- List The Degrees And Certificates You Earned
- 4 Reasons to Practice Mock Tests @ Youth4work!
- Youth4work Helps You To Showcase Your Talents
- Acknowledging yRank
- How To Take/Practice Prep Tests?
- How To Change Your Youth4work Profile Password?
- Blog To Strengthen Your Portfolio
- Profile Views In The Last 30 Days!
- Know Your Visitors
- Know When Profile Is Viewed
- Share Details To Get Contacted @ Y4W
- Work Experience Matters
- Transparent Talent Display Window For You To Choose From
- SBI PO Exam 2016: Know the Recent Changes in Pattern Here
- Don’t Hide Your Talents, Showcase It
- Define Yourself
- Analyze Skill-Sets Or Talents To Be Showcased
- 3 Reasons To Often Participate In Youth4work Talent Forums And Prep Tests
- Where To Find The Solutions Of Questions On Youth4work?
- Encountered ‘Log-In Error’? Relax And Follow These Simple Steps To Troubleshoot
- Approach Placements With Youth4work
- Sectional Preparation For CAT @ Youth4work Platform: What Is It And How It Works?
- Preparation For TOEIC @ Youth4work Platform: Know More
- Perfectly Timed Mock Tests At Youth4work: Understand The Strategy & How It Works?
- 4 Reasons To Practice Mock Tests @ Youth4work
- yTest: How The Online Talent Test Are Timed?
- Register As A Youth At Youth4work
- Why should I join Youth4work
- How Y4W Verifies And Showcases Your Talent?
- 10 Steps To Create A Strong Youth4work Profile
- Know-How: Talent Score Distribution
- Psychometric Test On Youth4work
- Understand yTests — Online Talent Tests
- Youth4Work Assessed Profile vs. Regular Online Profile
- Online Talent Test — yTest Question Analysis And Rating
- Now Design Your Own Mock Tests
- 7 Ways to Improve yRanks On Youth4work
- 6 Definitive Ways For Effective Communication Skills
- What Is A yChallenge?
- Compliments on Youth4work Profile
- Prep Report: Mirrors Your Performance
- A Guide To Earn Reputation Points At Youth4work
- Online Assessed Profile — Youth4work Profile Completeness Meter
- Understanding Youth4work Talent Forums.
- Youth4work Profile Popularity
- What Is a yTal Report On Youth4work?
- How To Check Your Reputation Scores?
- Excel In SSC CGL Exams With Youth4work Prep Tests?
- 4 Useful Tips to Prepare for Reasoning Section of SBI PO Preliminary Examination
- We help Students Prepare to Compete in the Corporate World
- Relevant Jobs For College Students
- Performance Test by Youth4work Campus Solutions
- Finding The Best College Involves Right Information Source: Youth4work Does It
- The Next Step For Your Career Is To Choose Your Ideal College
- Know A College From Its Students and Alumnus
- How To Find And Engage With Talents?
- Know And Engage With Your Followers
- Recruitment Optimization: WorkMail Feature
- yAccess — Youth4work Top Recruiter Account
- Youth4work Talent Search And yMatch
- For Recruiters: Build Up Your Company Profile
- Tips On Curtailing Employee Turnover Costs
- Corporate Premium Solutions: Explore, Adopt And Rule
- Employer Branding - Employer Product Feature
- How To Submit A Job Post Successfully On Youth4Work
- Managed Recruitment Services
- Hiring The Right Talent Must Be Worth
- RECRUITMENT OPTIMIZATION: WORK MAIL FEATURE ..!!!
- Know And Engage With Your Followers
- Manage Job Postings On Youth4work
- My Candidate Pool – Stay Connected To Your Candidate
- Unified Mailbox To Manage Conversations With Talent Pool
- WorkMails - Efficient And Affordable
- Company’s Terms Of Use
- Recruiter’s Community
- What Is yMatch On Youth4work?
- How To Find Local, Profiled, Ranked And Available Talent
- Are WorkMails Free For Companies And Youth?
- How To Use yAssess (Custom Tests) Tool?
- Custom yAssess — Your Own Testing World
- How Online Assessments Help In Campus Recruitment?
- FIXED TEST- A Self Assessment Test
- How Take Self Assessment Test On Youth4work?
- Custom Assessment Solution By Youth4work
- yAssess: Custom Tests Tool By Youth4work
- yAssess — Youth4work Assessment Delivery Capacities
- yAssess — FAQs on Youth4work Custom Online Assessments
Know-How: Talent Score Distribution
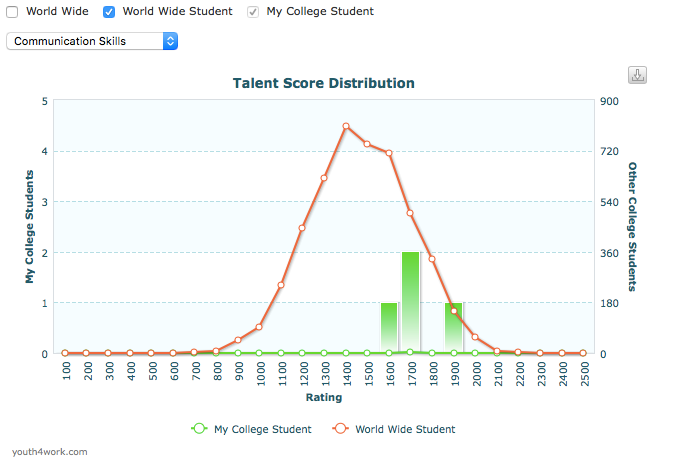
Each college has a different set of students who are talented in different domains. Each college will represent a certain performance in each talent. This performance is displayed by the Talent Score Distribution report. Following is the screenshot of a sample Talent Score Distribution.

The graph represents the normal distribution of scores achieved by college students in individual talent and skill-based tests (yTests) on a scale designed by Youth4work. This gives you an idea about the performance of all yTest takers, ROWC students and your college students, the mean score and how many people have achieved top scores. If your college graph’s peak point lies on the left side of ROWC, your college students need to improve and score more in subsequent attempts. Select the talent for which you would like to compare your college students. You can also select the worldwide option to compare against all the people (experienced candidates included) taking the yTest.
For more reports details, visit:
